Plantation Companies With Best Growth Potential (Part 2/2) - Bursa D
Author: Tan KW | Publish date: Mon, 24 Mar 12:08
Plantation Companies With Best Growth Potential (Part 1/2) - Bursa D
* EBIT only
From calculation of EVM, FR still has the lowest or best value. Besides, SOP, TDM & THP also looks better compared to their relatively high PE ratio. JT still has the highest numbers, but not as high as its PE due to its high depreciation and amortization in FY2013.
Plantation Companies With Best Growth Potential (Part 1/2) - Bursa D
Monday, 24 March 2014
At least for me, it is not easy to value a plantation company.
Since most companies' financial year end in December, at this time we can get their latest PE ratio for direct comparison.
However, I think current actual PE ratio does not show or predict
the true value of plantation stocks, as the most important factor to
value them is their future growth in earning, which are linked to FFB
growth and future CPO price.
CPO price might not be easy to predict, but FFB growth is largely predictable.
If we have detail palm age profile or yearly new planted area,
then we can roughly calculate the future FFB production base on
historical FFB yield per hectare for certain tree age groups.
So, companies with high PE ratio because of poor earning at the
moment may see their earning suddenly jump tremendously due to
substantial increase in FFB production, as majority of trees enter prime
age.
As stated in Plantation Companies With Best Growth Potential (Part 1), companies with the largest percentage of immature & young trees below 7 years are as follow:
I think it is still useful to look into the latest PE ratio of
those 10 plantation companies. All companies' PE ratio shown in the
table below are the latest with FY end in December, except IJMP (Mac)
& JT (Jun).
Table 1: PE Ratio
| PE Ratio | |
| FR | 13.4 |
| TA | 17.3 |
| TSH | 18.7 |
| BUMI | 19.7 |
| IJMP | 24.4 |
| THP | 28.0 |
| SOP | 29.3 |
| TDM | 30.0 |
| GENP | 35.0 |
| JT | 113.8 |
From the table above, JT might have a sky high PE ratio. However,
it also has the highest FFB growth potential with the highest percentage
of young & immature trees.
Both TSH and BUMI have relatively low PE ratio below 20x, and they
also possess the highest percentage of young trees after JT. Thus, it
seems like TSH and BUMI are the better bet at the moment.
FR has the lowest PE and decent percentage of young trees at
58.8%. It definitely looks good as well but why the market gives it a
lower PE compared to its peers? There is a reason behind it.
There is another method to value a company which is Enterprise Value Multiple (EVM). It is calculated as EV/EBITDA. It roughly shows how many years it would take to pay off the acquisition cost if the company is to be acquired at enterprise value. Similar to PE ratio, the lower the better.
Table 2: EV/EBITDA
| RM mil | EV | EBITDA | EV/EBITDA |
| FR | 13085.1 | 1121.3 | 11.7 |
| BUMI | 6054.7 | 425.8 | 14.2 |
| GENP | 8185.4 | 373.1 | 21.9 |
| TSH | 3737.2 | 224.7 | 16.6 |
| JT | 3539.2 | 144.6 | 24.4 |
| SOP | 3296.7 | 250.0 | 13.2 |
| THP | 3015.3 | 169.9 | 17.7 |
| IJMP | 2938.8 | *159.5 | *18.4 |
| TA | 1877.6 | 155.9 | 12.0 |
| TDM | 1557.9 | 96.1 | 16.2 |
* EBIT only
From calculation of EVM, FR still has the lowest or best value. Besides, SOP, TDM & THP also looks better compared to their relatively high PE ratio. JT still has the highest numbers, but not as high as its PE due to its high depreciation and amortization in FY2013.
With limited information on hand, I'm unable to calculate the
estimated FFB production and earning of these companies in the future.
However, those professional analysts can.
Below are the current price and latest target price by analysts
for these 10 companies. For consistency, I will quote the target price
given by RHB as RHB covers most of these stocks. All the target price
are derived after the release of company's latest financial results.
Table 3: Target Price & Potential Upside
| Stocks | Actual Price | Target Price | Analyst | Potential Upside (%) |
| FR | 2.33 | 2.70 | MB | 15.9 |
| TA | 4.28 | 5.00 | RHB | 16.8 |
| TSH | 3.16 | 3.19 | RHB | 1.0 |
| BUMI | 1.05 | 1.39 | RHB | 32.4 |
| IJMP | 3.3 | 3.80 | KNG | 15.2 |
| THP | 1.99 | 2.10 | MIDF | 5.5 |
| SOP | 6.5 | 7.04 | RHB | 8.3 |
| TDM | 0.93 | 1.04 | RHB | 11.8 |
| GENP | 10.5 | 11.20 | RHB | 6.7 |
| JT | 2.73 | 2.95 | RHB | 8.1 |
JT and TSH are thought to have exponential growth in the future,
but the potential upside of their share price are just 8.1% & 1.0%
respectively. However, this target price is for calendar year 2014,
which means it has limited upside for this year only. In the next few
years, "barring any unforeseen circumstances", both companies' FFB
production and profit will go up substantially and their target price
will be revised upwards.
Many investors have already taken position in some hot and great
plantation stocks. This results in their relatively high share price
with limited upside at the moment. For long term investors, the target
price by analysts might not be that important.
Anyway, it is still desirable to find one with high potential
upside in year 2014. Obviously there is one here, which is Bumitama.
In term of NTA (net tangible assets), most companies' share prices
are 2-3 times more than their NTAs. Only TDM which is not a pure
plantation stock has share price closest to its NTA.
Table 4: NTA
| Price | NTA | |
| FR | 2.33 | 0.80 |
| TA | 4.28 | 2.72 |
| TSH | 3.16 | 1.19 |
| BUMI | 1.05 | 0.39 |
| IJMP | 3.3 | 1.60 |
| THP | 1.99 | 1.35 |
| SOP | 6.5 | 2.82 |
| TDM | 0.93 | 0.84 |
| GENP | 10.5 | 4.52 |
| JT | 2.73 | 1.80 |
Fundamental investors always look for companies with high ROE.
Higher ROE means higher profitability in which the company can generate
more profit from its shareholders fund.
Besides ROE, it is also important that the gearing is at a
comfortable level. The lower the gearing, the less risky it is when
unforeseen disaster strike the company or plantation industry.
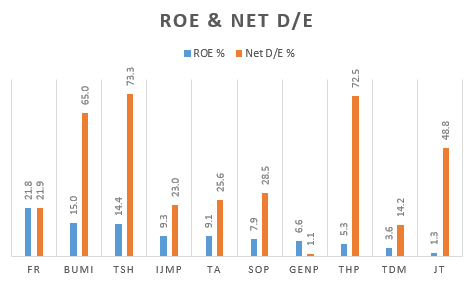
Chart 3: ROE and Gearing
First Resources has excellent ROE at 21.8%, while Bumitama and TSH also meet my selection criteria of around 15 and above.
It is obvious that those companies with high percentage of young
trees through aggressive new planting in recent years have the highest
net debt/equity ratio. If you own those companies with high gearing
ratio, then better pray that their FFB production grows according to
plan and no unforeseen circumstances strike within the next few years.
Personally I hope to own a pure plantation company but TA, JT, GENP & TDM are not.
If not mistaken, only First Resources is involved in downstream
business with palm oil processing and refining facilities. This is a
plus point for me.
In summary, there is no "the best" plantation stock.
However, the one that caught my eyes is Bumitama, which stands out
in all aspect except its lower FFB yield, slightly higher PE ratio and
high gearing.
First Resources is also not bad at all with its excellent
management (high ROE, low gearing with unbelievable margin), low PE
ratio or EVM and more than 50% of young & immature trees.
The worries for First Resources are the recent significant fall in
FFB yield and also the expiry of its locked-in CPO forward sales at a
high average selling price of around RM2850 throughout year 2012-2013.
So, FR will depend more on its FFB production growth to drive up its
revenue and profit in 2014, not the CPO price.
This may explain why the market gives FR a lower PE as the growth in profit for 2014 might be only a little or negative.
Anyway, I think FR is still a superb plantation stock to own in long term.
For Malaysia's side, I think I will go for a pure plantation
company with high percentage of young trees, if I were to invest in one.
http://bursadummy.blogspot.com/2014/03/plantation-companies-with-best-growth_24.html


没有评论:
发表评论