Leave a reply
Clear diagram actually can speak for itself. So can a simple cash flow diagram to convey a strong message. It helps you to see the big picture. From there, you can make a better decision for your financial planning.
Common Cash Flow
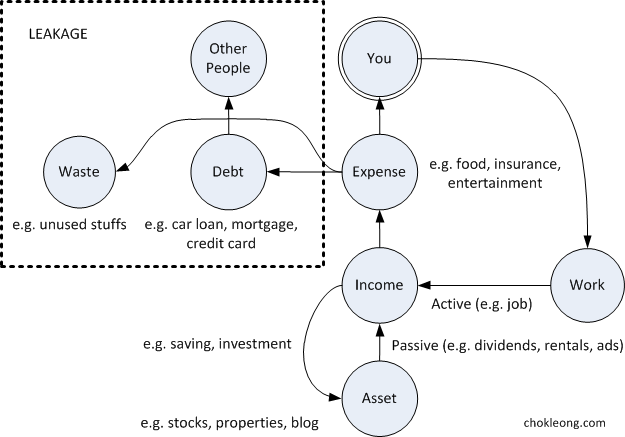
Common Cash Flow
With the actively generated income, Bob can choose to either save or invest part of his income into assets like fixed deposits, bonds, stocks and properties. The rest of his income will go to the expenses like food, insurance and entertainment. These are the basic needs to support his life.
Part of the things that he owns like car, house, and credit cards will incur debts. The interests that come with the debts will go to support other people. In other words, a part of the income from Bob’s hard work goes to pay for other people.
Not only that, there are things that are unused or underutilized that contribute to waste like extra clothing, expensive paintings, big house, etc. The waste and debt both play a major role in Bob’s cash flow. They eat away his income. I call this the leakage in the cash flow.
His work is transformed into waste. Not a good plan at all.
Ideal Cash Flow
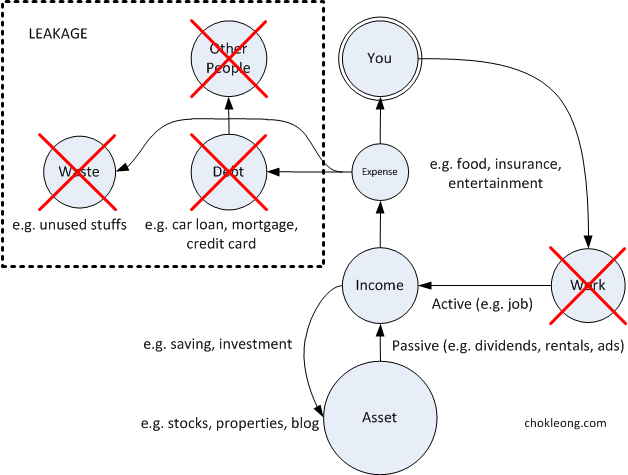
Ideal Cash Flow
Since Bob has a habit of saving and investing, his assets will grow over time. With less expense, he has even more income to contribute to his saving and investment. This makes his passive income from his assets large enough to cover all his, now reduced, expense.
There is a positive loop in effect here. The less expense Bob has, the more he can save and invest to grow his asset. Since he spends a lot less than before, his passive income from larger asset can cover easily his expense and therefore, he could literally stop working!
The final version of the ideal cash flow diagram is reduced to only 4 circles: big asset, income, small expense and you. The simplified cash flow is more efficient and once Bob achieves the final cash flow, he has achieved financial independence.
Once reaching financial independence, Bob doesn’t need to spend his life working anymore. Working is now a choice and not a must for Bob. In case he chooses to stop working, he has time to start full time living. What a wonderful plan.
Which cash flow diagram best describe your current financial situation now? Which one do you prefer to have? I bet the second one, the ideal cash flow.